> ## Documentation Index
> Fetch the complete documentation index at: https://dragonwingdocs-staging.qualcomm.com/llms.txt
> Use this file to discover all available pages before exploring further.
# IQ-615
## 调试 DisplayPort
mini DisplayPort 连接器对应 `DP-1`。在执行以下检查之前,运行 `connector=DP-1`。这将选择 mini DisplayPort 连接器。
通过 SSH 连接到目标设备,并在 root shell 中运行目标设备命令。有关说明,请参阅 [使用 SSH 登录](https://dragonwingdocs.qualcomm.com/Key-Documents/Flash-Guide/how-to-sign-in-with-ssh)。
| **板载连接器** | **Linux DRM 连接器** |
| - | - |
| Mini DisplayPort | DP-1 |
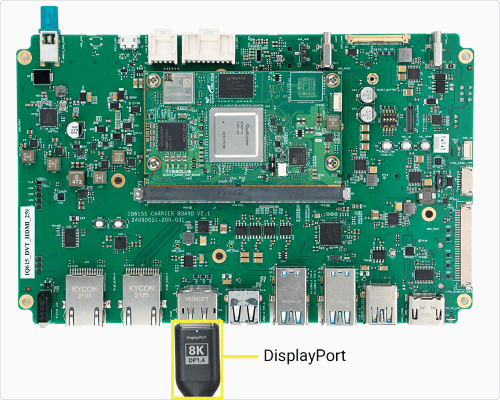
**图:IQ-615 DisplayPort 连接**
上述连接器映射因平台而异,并决定了后续使用的 connector 值。除此之外,七个故障排除步骤在每个 DisplayPort 页面上都相同。
### 1. 识别连接器
运行以下命令:
> ```text theme={null}
> modetest -M msm -c
> ```
此命令列出 DRM 连接器及其 ID 和连接状态。
### 2. 检查连接器状态和模式
运行以下命令:
> ```text theme={null}
> cat "/sys/class/drm/card0-${connector}/status"
> ```
此命令报告所选连接器是否已连接。预期结果为 `connected`。
参考输出
```text theme={null}
connected
```
运行以下命令:
> ```text theme={null}
> cat "/sys/class/drm/card0-${connector}/modes"
> ```
此命令列出所连接显示器报告的模式。
已连接的输出通常至少报告一种模式。如果状态为 `disconnected`,请检查电缆、显示器电源以及所选的显示器输入源。如果 `card0` 不存在,请使用 `modetest` 报告的 DRM card。
如果未挂载 `debugfs`,请运行以下命令:
> ```text theme={null}
> mount -t debugfs none /sys/kernel/debug
> ```
这样即可访问 DRM 状态和接口调试数据。
运行以下命令:
> ```text theme={null}
> modetest -M msm -c -p
> ```
此命令显示所选连接器的 encoder、CRTC、模式和 plane。
参考输出
```text theme={null}
CRTCs:
id fb pos size
75 78 (0,0) (1920x1080)
#0 1920x1080 60.00
```
运行以下命令:
> ```text theme={null}
> cat /sys/kernel/debug/dri/0/state
> ```
此命令显示每个连接器、encoder、CRTC 和 plane 的内核 DRM 状态。
对于所选连接器,确认存在一条活动的显示管道:
* `status: connected`
* 已为该连接器分配 encoder
* 该 encoder 对应的 CRTC ID 不为零
* 该 CRTC 为 `active=yes`
* 某个 plane 的 `crtc` 字段与该 CRTC ID 匹配
只有满足以上所有条件,才会有可见输出。
**测试显示模式后恢复 Weston。**
要测试其他模式,请按照 [运行 DRM modetest](run-drm-modetest) 操作,然后在返回 Weston 测试之前 [重新启动 Weston](troubleshoot-relaunch-weston)。
运行以下命令:
> ```text theme={null}
> cat "/sys/kernel/debug/dri/0/${connector}/dp_debug"
> ```
当驱动程序提供 `dp_debug` 时,此命令显示 DisplayPort 链路速率、通道数和面板时序。
参考输出
```text theme={null}
name = msm_dp
drm_dp_link
rate = 270000
num_lanes = 4
dp_panel_info:
active = 1920x1080
refresh rate = 60
```
运行以下命令:
> ```text theme={null}
> cat /sys/kernel/debug/clk/*dp*link_clk/clk_rate
> ```
此命令以 Hz 为单位打印 DisplayPort 链路时钟速率。
参考输出
```text theme={null}
disp_cc_mdss_dp_link_clk: 270000000
```
运行以下命令:
> ```text theme={null}
> cat /sys/kernel/debug/clk/*dp*pixel*clk/clk_rate
> ```
此命令以 Hz 为单位打印 DisplayPort 像素时钟速率。
参考输出
```text theme={null}
disp_cc_mdss_dp_pixel_clk: 74250000
```
正常工作的链路具有非零的速率和通道数值,并至少报告一种模式。将像素时钟与活动 CRTC 模式进行比较,`modetest` 以 kHz 为单位报告该模式。
运行以下命令:
> ```text theme={null}
> journalctl -k -b --no-pager -o short-monotonic | grep -Ei 'msm[_-]dp|displayport|edp|dp_aux|link.*train|hpd|typec|ucsi|pmic_glink|dpu|drm'
> ```
此命令仅显示当前启动中的 DisplayPort 和 DRM 消息。如果没有返回任何行,请在复现问题时捕获实时数据。
参考输出
```text theme={null}
[ 12.512759] [drm] Initialized msm 1.13.0 for ae01000.display-controller
```
要在复现问题时捕获显示事件,请运行以下命令:
> ```text theme={null}
> journalctl -f
> ```
此命令跟踪新的 Weston 和内核消息。运行时不要加 `-k`,以便输出包含合成器的连接器变化和输出启用信息。复现问题,然后按 `Ctrl+C`。
查找连接器状态变化、EDID 或模式检测、输出启用以及驱动程序错误。将相关消息与连接器状态和活动 DRM 状态进行比较。
AUX 或 DPCD 超时表明电缆或端口存在问题,链路训练失败则表明链路质量存在问题。
| **结果** | **可能的问题区域** | **后续操作** |
| - | - | - |
| `disconnected` | 电缆或显示器输入源 | 重新插拔电缆并选择正确的显示器输入源。 |
| 已连接但无模式,或出现 AUX/DPCD 超时 | 电缆、端口或 EDID | 检查电缆和显示器,然后在跟踪实时日志的同时重新连接。 |
| 链路训练失败 | 电缆或信号质量 | 尝试使用已知良好的电缆和较低带宽的模式。 |
| 存在模式,但连接器、encoder、CRTC 和 plane 未构成一条活动管道 | DRM 或合成器 | 检查活动 DRM 状态和 Weston 状态。 |
| 重新连接后没有新的显示消息,连接器状态也没有变化 | HPD 或 Type-C Alt Mode | 检查端口、Type-C 插入方向和电缆。 |
**在检查输出布局之前验证 Weston 服务。**
运行以下命令:
```text theme={null}
systemctl is-active weston
```
预期结果为 `active`。如果服务未处于活动状态,请先 [重新启动 Weston](troubleshoot-relaunch-weston),然后再继续。
### 7. 检查 Weston 和输出布局
运行以下命令:
> ```text theme={null}
> journalctl -b -u weston -n 40 --no-pager
> ```
此命令显示当前启动中最新的 Weston 消息。
如果 Weston 处于活动状态但显示屏为空白,请运行以下命令:
> ```text theme={null}
> find /run/user/ -maxdepth 1 -type s -name 'wayland-*' -printf '%f\n'
> ```
此命令列出可用的 Wayland socket 名称。
替换占位符后运行以下命令:
> ```text theme={null}
> runuser -u weston -- env XDG_RUNTIME_DIR=/run/user/ WAYLAND_DISPLAY= wayland-info
> ```
**将 Weston 输出与 DRM 状态进行比较。**
此命令打印 Weston 输出信息。找到所选的显示输出,并将其与 DRM 连接器和 CRTC 状态进行比较。如果 Weston 未处于活动状态,请先 [重新启动 Weston](troubleshoot-relaunch-weston),然后再继续。