> ## Documentation Index
> Fetch the complete documentation index at: https://dragonwingdocs-staging.qualcomm.com/llms.txt
> Use this file to discover all available pages before exploring further.
# RTSS test commands
Use the RTSS test commands to test the drivers. By default, the RTSS software supports the CLI test commands through the UART terminal. Run the test commands to generate the logs.
**Caution**
Before executing any RTSS CPU core 3 test commands, enable RTSS CPU core 3. For enablement instructions, see *RTSS CPU3 enablement* in [QCS9075M Hardware Design Guide](https://docs.qualcomm.com/doc/80-73418-5/80-73418-5_REV_AE_QCS9075M_Hardware_Design_Guide.pdf).
## **Prerequisites**
* [Set up debug UART](https://dragonwingdocs.qualcomm.com/Linux/devices/iq9075-evk/set-up-the-device#set-up-the-debug-uart).
* Go to UART terminal.
* To enable logging on to UART terminal, do the following:
1. Select Enter in the UART Shell to access `sail_proc@home$`.
The following sample output shows the logs that confirm the access to `sail_proc@home$`.
```text theme={null}
c0[ 34.609865s] Running in APPL_SAIL_Shell_start 0
c0[ 34.609912s]CPU 0 -:
c0[ 34.609995s]Use help or exit command....
c0[ 34.610084s]sail_proc@home$
```
2. Run `setlog ` on the UART terminal to set the allowed logging based on level and privilege.
Parameters:
* ``: info, err, warn, or dbg
* ``: el1 or el2
For example,
```text theme={null}
setlog info el1
```
The following sample output shows the logs for loglevel set to LOG\_INFO:
```text theme={null}
c0[ 208.449904s]CPU 0 -: setlog info el1
c0[ 208.450087s]>>>>>> EL1 UART loglevel set to LOG_INFO Success <<<<<<<
c0[ 208.450153s]Use help or exit command….
c0[ 208.450190s]sail_proc@home$
```
## **Procedure**
Run the following commands and verify the logs to validate the successful execution of commands:
* `help`
* `gpio`
* `i2cel1`
* `spi`
* `gpttmr_test`
* `ospinor_el1`
* `can`
### **help**
Run `help` on the UART terminal to know about the list of supported commands and their usage.
For example,
```text theme={null}
help
```
The following sample logs show the usage references and command references:
```text theme={null}
c0[ 1954.278799s]use help or exit command….
c0[ 1954.278837s]sail_proc@home$
c0[ 1955.755765s]===== SAIL Command Usage =====
c0[ 1955.755802s]1) getsailversion
usage -: getsailversion ( No param for this cmd)
c0[ 1955.755954s]2) i2cel1
usage -: i2cel1
c0[ 1955.756032s]3) spi
usage -: spi
c0[ 1955.756075s]4) gpt
usage -: gpt start < value >
gpt stop
gpt stats
c0[ 1955.756161s]5) setlog
usage -: setlog info el1
usage -: setlog err el1
usage -: setlog warn el1
usage -: setlog dbg el1
usage -: setlog info el2
usage -: setlog err el2
usage -: setlog warn el2
usage -: setlog dbg el2
c0[ 1955.756272s]use help or exit command….
c0[ 1955.756350s]sail_proc@home$
```
### **gpio**
Run the following `gpio` commands on the UART terminal to do the GPIO functional test.
**Note**
GPIO 11 is used as the reference GPIO number in all examples below. Replace `` with the actual GPIO number available on your hardware. The canMailboxTask: MD S1 NOT READY!!! messages on core c1 are CAN mailbox background messages and don’t affect GPIO test results.
* `gpio`
Run the generic GPIO test suite that covers all basic test cases (TC\_GPIO\_000 through TC\_GPIO\_004).
For example,
```text theme={null}
gpio
```
Parameters: None
Sample logs:
```text theme={null}
c0[ 73.676259s]Invalid test command, running generic test cases
c0[ 73.676304s] GPIO test started
c0[ 73.676365s][TC_GPIO_000] Passed
c0[ 73.676424s][TC_GPIO_001] Passed
c0[ 73.676483s][TC_GPIO_002] Passed
c0[ 73.676556s][TC_GPIO_003] Passed
c0[ 73.676592s][TC_GPIO_004] Passed
c0[ 73.676673s][GPIO tests Passed]
```
* `gpio input `
Configure a GPIO pin as input using the RAW driver interface.
Parameter:
``: GPIO pin number to configure as input.
For example,
```text theme={null}
gpio input 11
```
Sample logs:
```text theme={null}
c0[ 129.470335s]Configuring gpio 11 as input with RAW
```
* `gpio output `
Configure a GPIO pin as output using the RAW driver interface.
Parameter:
``: GPIO pin number to configure as input.
For example,
```text theme={null}
gpio output 11
```
Sample logs:
```text theme={null}
c0[ 142.044699s]Configuring gpio 11 as output with RAW
```
* `gpio high `
Drive a GPIO pin to logic high using the RAW driver interface.
Parameter:
``: GPIO pin number to drive high.
For example,
```text theme={null}
gpio high 11
```
Sample logs:
c0\[ 156.699917s]Setting gpio 11 as High with RAW
* `gpio low `
Drive a GPIO pin to logic low using the RAW driver interface.
Parameter:
``: GPIO pin number to drive low.
For example,
```text theme={null}
gpio low 11
```
Sample logs:
c0\[ 168.908299s]Setting gpio 11 as Low with RAW
* `gpio read `
Read and report the current logic state of a GPIO pin.
Parameter:
``: GPIO pin number to read.
For example,
```text theme={null}
gpio read 11
```
Sample logs:
```text theme={null}
c0[ 129.470335s]Configuring gpio 11 as input with RAW
```
* `gpio intr_low `
**Note**
The `gpio intr_low`, `gpio intr_high`, `gpio intr_rising`, `gpio intr_falling`, and `gpio intr_dual` commands register summary interrupts for the specified GPIO. Before configuring the same GPIO with a different interrupt trigger type, deregister the existing summary interrupt by running `gpio summary_intr_dereg `
Enable a low-level triggered interrupt on a GPIO pin.
Parameter:
``: GPIO pin number on which to enable low-level interrupt.
For example,
```text theme={null}
gpio intr_low 11
```
Sample logs:
c0\[ 192.765044s]Enabled Low Level Interrupt on gpio 11 with RAW
* `gpio intr_high `
Enable a high-level triggered interrupt on a GPIO pin.
Parameter:
``: GPIO pin number on which to enable high-level interrupt.
For example,
```text theme={null}
gpio intr_high 11
```
Sample logs:
c0\[ 502.252913s]Enabled High Level Interrupt on gpio 11 with RAW
* `gpio intr_rising `
Enable a rising-edge triggered interrupt on a GPIO pin.
Parameter:
``: GPIO pin number on which to enable rising-edge interrupt.
For example,
```text theme={null}
gpio intr_rising 11
```
Sample logs:
```text theme={null}
c0[ 525.837697s]Enabled Low Level Interrupt on gpio 11 with RAW
```
Note
The log reports Low Level Interrupt instead of Rising Edge Interrupt. Verify whether this is the expected firmware behaviour or flag it as a log string defect in the driver.
* `gpio intr_falling `
Enable a falling-edge triggered interrupt on a GPIO pin.
Parameter:
``: GPIO pin number on which to enable falling-edge interrupt.
For example,
```text theme={null}
gpio intr_falling 11
```
Sample logs:
```text theme={null}
c0[ 3524.072550s]Enabled Falling Edge Interrupt on gpio 11 with RAW
```
* `gpio intr_dual `
Enable a dual-edge (both rising and falling) triggered interrupt on a GPIO pin.
Parameter:
``: GPIO pin number on which to enable dual-edge interrupt.
For example,
```text theme={null}
gpio intr_dual 11
```
Sample logs:
```text theme={null}
c0[ 3550.232162s]Enabled Dual Edge Interrupt on gpio 11 with RAW
```
* `gpio intr_trigger `
Wait and validate an interrupt trigger on a GPIO pin. The command blocks until the interrupt fires and the ISR executes.
Parameter:
``: GPIO pin number on which to trigger and validate the interrupt.
For example,
```text theme={null}
gpio intr_trigger 11
```
Sample logs:
```text theme={null}
c0[ 3583.831676s]Waiting for GPIO 11 interrupt
c0[ 3583.831716s]Interrupt Trigged and ISR executed on gpio 11 with RAW
```
* `gpio direct_intr_dereg `
Deregister a previously registered direct interrupt handler on a GPIO pin.
Parameter:
``: GPIO pin number from which to deregister direct interrupt.
For example,
```text theme={null}
gpio direct_intr_dereg 11
```
Sample logs:
c0\[ 453.821464s]Direct Interrupt deregister test passed
* `gpio summary_intr_reg `
Register a summary interrupt handler on a GPIO pin and validate the registration.
Parameter:
``: GPIO pin number on which to register summary interrupt.
For example,
```text theme={null}
gpio summary_intr_reg 11
```
Sample logs:
```text theme={null}
c0[ 322.686293s]Summary Interrupt register test passed
```
* `gpio summary_intr_dereg `
Deregister a previously registered summary interrupt handler on a GPIO pin.
Parameter:
``: GPIO pin number from which to deregister summary interrupt.
For example,
```text theme={null}
gpio summary_intr_dereg 11
```
Sample logs:
```text theme={null}
c0[ 222.156534s]Summary Interrupt deregister test passed
```
### **i2cel1**
Run `i2cel1` on the UART terminal to do the I2C functional test.
Note
The `i2cel1` test command is for i2c0 only. For i2c1, you must update the test application.
Note
> PMIC is connected to I2C.
PMIC is connected to I2C.
Parameters: None
For example,
```text theme={null}
i2cel1
```
The following sample logs show the successful validation of the `i2cel1` command:
```text theme={null}
c0[ 57.020413s]>>>>>> I2C El1 Test Cases Started <<<<<<<
c0[ 57.020481s][TC_I2C_EL1_01] I2C El1 Initialization test
c0[ 57.021221s][TC_I2C_EL1_01] I2C0 Init Success.
c0[ 57.021967s][TC_I2C_EL1_01] I2C1 Init Success.
c0[ 57.022033s][TC_I2C_EL1_01] I2C El1 DMA Initialization test Passed
c0[ 57.022095s][TC_I2C_EL1_02] I2C El1 Get Secondary Address test
c0[ 57.022208s][TC_I2C_EL1_02] xI2c_EL1_GetSecondaryAddress Success for PAGE_ID_0 Secondary address= 0x28.
::::::::
c0[ 57.035789s][TC_I2C_EL1_08] I2C El1 DeInit-ReInit-DeInit test
c0[ 57.039229s][TC_I2C_EL1_08] I2C El1 DeInit-ReInit-DeInit test Passed
c0[ 57.039291s]I2C EL1 Unit test validation Passed!!!
```
Note
To get all the I2C test result logs, enable the INFO log level by running the following command:
```text theme={null}
setlog info el1
```
### **spi**
Run `spi` on the UART terminal to do the SPI functional test.
Note
The `spi` test command is for spi0 only. For multiple SPI channels, you must configure the DTS file.
Parameters: None
For example,
```text theme={null}
spi
```
The following sample logs show the successful validation of the `spi` command:
```text theme={null}
c1[ 8.411406s][TC_SPI_001]: Test Synchronous transmission in Loopback mode - Passed
c1[ 8.411743s][TC_SPI_005]: Test - Write/Read TCAN0 Scratch register - Failed
c1[ 8.411796s][TC_SPI_009]: Test Spi_GetSequenceResult API for a sequence ID in sync mode - Passed
c1[ 8.411824s][TC_SPI_010]: Test Spi_GetStatus API for Spi Handler driver - Passed
```
Note
`TC_SPI_002`/`TC_SPI_003`/`TC_SPI_005` are expected to fail due to no device ID and scratch register. These test cases will be removed in a future release.
Note
To enable the SPI loopback, add the following code changes in Spi\_PBcfg.c:
```text theme={null}
--- a/SAIL.SI.1.2/sail_proc/BSP/spi/src/Spi_PBcfg.c
+++ b/SAIL.SI.1.2/sail_proc/BSP/spi/src/Spi_PBcfg.c
@@ -212,7 +212,7 @@ SPI_RO static const Spi_JobConfigType Spi_JobConfig[] =
.SpiJobId = 0,
.SpiChannelAssignment = SpiJob_0_ChannelList,
.SpiChannelsPerJob = 1,
- .SpiInternalLoopBack = FALSE,
- .SpiInternalLoopBack = TRUE, /\* Change from FALSE to TRUE for loopback test \*/
.SpiJobEndNotification = NULL_PTR,
.SpiJobPriority = 0,
.SpiHwUnit = CSIB1,
```
Note
Due to a known task-priority issue, the SPI test case may occasionally fail to execute. If the SPI test case doesn’t run, apply the following changes and re-test. This will be fixed in the future release.
```text theme={null}
--- a/SAIL.SI.1.2/sail_proc/BSP/sailfreertos/src/freertos_init.c
+++ b/SAIL.SI.1.2/sail_proc/BSP/sailfreertos/src/freertos_init.c
@@ -208,7 +208,7 @@ static const FreertosTaskSchedulingTableType xTaskInitTable[] =
{
/*** CPU0 ***/
{ CPU0, TASK_PRIOR_5, xISDTaskInit, NULL },
- { CPU0, TASK_PRIOR_3, xSAILshellTaskInit_core0, xAPPLShellTaskRTOSFeatureInit },
+ { CPU0, TASK_PRIOR_5, xSAILshellTaskInit_core0, xAPPLShellTaskRTOSFeatureInit },
{ CPU0, TASK_PRIOR_3, xSAILConsoleUartTaskInit, xSAILConsoleUartTaskRTOSFeatureInit },
{ CPU0, TASK_PRIOR_5, xSleepTaskInit_core0, xSleep_Task_Resources_Init },
{ CPU0, TASK_PRIOR_3, xSpinorEL1TaskInit, xSpinorEl1TaskResourceInit }, // SPINOR task needs to run at the same priority
0 @@ -232,7 +232,7 @@ static const FreertosTaskSchedulingTableType xTaskInitTable[]
```
### **gpttmr\_test**
Run `gpttmr_test` on the UART terminal to do the GPT functional test.
Note
Running `gpttmr_test` across different RTSS clusters (CPU cores) can expose interrupt-handling issues that may occasionally result in a device crash. However, there is no functional issue with the GPT driver itself.
The following are the various gpttmr\_test commands:
* `gpttmr_test ft `
N: \<0/1/2/3> specifies the core on which the test will run.
The user can explicitly select the core using this parameter. If no core is specified, the test will run on Core 0 by default.
> * `gpttmr_test ft 3` - Runs the functional test on core 3
> * `gpttmr_test ft` - Runs the test on core 0 (default)
For example,
```text theme={null}
gpttmr_test ft <0>
```
The following sample logs show the initialization of the timer test:
```text theme={null}
c0[169.001665s] vTestsGPTTimerTask: Command 0
c0[169.002315s] GPT_TMR_01 PASS
c0[169.003194s] GPT_TMR_06 PASS
::::::::::::::::::::
c0[169.014386s] GPT_TMR_13 PASS
c0[169.004610s] Gpt_Notification1_test: elapsed=0x15 rem=0x26E6 total=0x26FB diff=21
c0[169.015955s] xTestsGPTTimerTaskInit created
```
* `gpttmr_test stats`
The command prints the tick count delta and represents the difference between the configured target tick count and the actual tick count. It can be used to evaluate the accuracy and performance of the timer functionality. The following sample logs show the statistics for various GPT channels:
For example,
```text theme={null}
gpttmr_test stats
```
```text theme={null}
c0[ 1535.304438s]sail_proc@home$
c0[ 1537.554277s]<<<>>>
c0[ 1537.554322s]High: 0
c0[ 1537.554470s]Low: 0
c0[ 1537.554510s]Avg is : 0
c0[ 1537.554543s]iters: 0
c0[ 1537.554619s]<<<>>>
c0[ 1537.557848s]<<<>>>
c0[ 1537.557900s]High: 0
c0[ 1537.557933s]Low: 0
c0[ 1537.558008s]Avg is : 0
c0[ 1537.558041s]iters: 0
c0[ 1537.558116s]<<<>>>
```
### **ospinor\_el1**
Run `ospinor_el1` on the UART terminal to do the SPI functional test. The command executes the positive and async test to evaluate the SPINOR memory read, write, and erase functionality.
Parameters: None
For example,
> ```text theme={null}
> ospinor_el1
> ```
The following sample logs show the successful validation of the `ospinor_el1` command:
```text theme={null}
c0[ 436.821866s] sail_proc@home$
c0[ 444.831501s] TC_SPINOR_EL1_001–015—Passed
c0[ 444.956701s] TC_SPINOR_EL1_019: Erase start and end block validation—Skipped → Passed
c0[ 444.990570s] TC_SPINOR_EL1_binCmdTest—Passed
c0[ 445.033265s] TC_SPINOR_ASYNC_EL1_001: Erase/Write/Read Async (Higher priority)—Passed
c0[ 445.034609s] xSpinorEL1TestHiTask: Terminating Task
c0[ 445.077439s] TC_SPINOR_ASYNC_EL1_002: Erase/Write/Read Async (Lower priority)—Passed
c0[ 445.077536s] SPINOR EL1 all test cases passed
c0[ 445.078127s] xSpinorEL1TestLoTask: Terminating Task
```
### **CAN – RTSS test commands**
Run the following `can` commands on the UART terminal to do the CAN functional test:
* `can init`
* `can TX`
* `can RX`
**Run CAN test commands**
* `can init`
Syntax:
```text theme={null}
can -t 0 -config 1
```
Sample logs for `can -t 0 -config 1`:
```text theme={null}
c0[ 736.054477s][ UART-CAN ] Queue send for core 1 pass
c1[ 736.054535s]vSAILAPPLShelltask_core1: Rx Seq Q SUCCESS -:can -t 0 -config 1
c1[ 736.054562s]can_mcal_test : 422 Entered string : can -t 0 -config 1
c1[ 736.054594s]Invoked CanTC_Init
c1[ 736.056247s] CanTest_Register ClientHandle 0xffff0004 invoked with status: 0
c1[ 736.056281s] CanTest_Register client No.1 is redisted
c0[ 736.056482s]sail_proc@home$
c1[ 736.056554s]Can Test Callback Registration Done
c1[ 736.056576s]Exiting Can Testapp with return : 0
```
`can TX - standard ID`
Syntax:
```text theme={null}
can -t 3 -c x
```
Parameters: `x` = CAN controller ID: 0 to 7
Sample logs for `can -t 3 -c 1`
```text theme={null}
c0[ 45.127555s][ UART-CAN ] Queue send for core 1 pass
c1[ 45.127604s]vSAILAPPLShelltask_core1: Rx Seq Q SUCCESS -:can -t 3 -c 1
c1[ 45.127632s]can_mcal_test : 422 Entered string : can -t 3 -c 1
c1[ 45.127664s]Invoked CanTC_Write
c1[ 45.228388s]Can_Mb_Sd_CanSrv_Tx_Callback with swPduHandle: 1, Hth: 3, timeStamp.sec:26 timeStamp.ns:131600000
c1[ 45.228433s]CanTest_TxConfirmation with swPduHandle: 1, Hth: 3, timeStamp.sec:26 timeStamp.ns:131600000
c1[ 45.278575s]xCanSrv_Write Successful on object 6 with swPduHandle 1
c1[ 45.278609s]Exiting Can Testapp with return : 0
```
The CAN TX data shows up on the PCAN-View application.
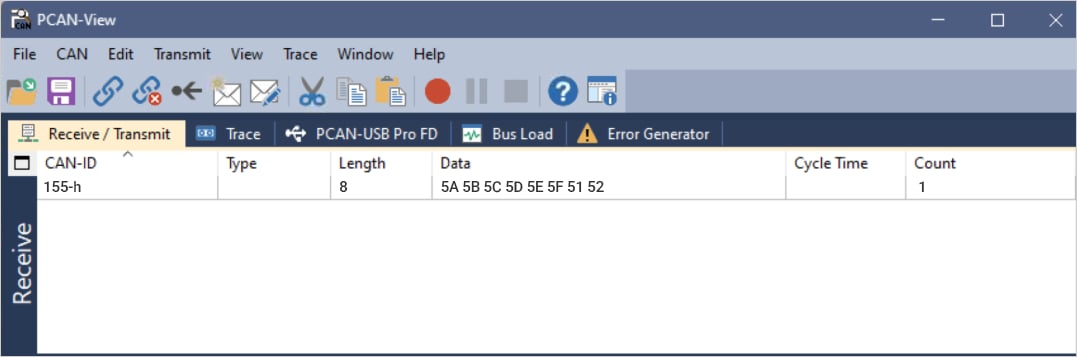 `can TX - FD ID`
Syntax:
```text theme={null}
can -t 5 -c x
```
Parameters: `x` = CAN controller ID: 0 to 7
Sample logs for `can -t 5 -c 1`
```text theme={null}
c0[ 51.175227s][ UART-CAN ] Queue send for core 1 pass
c1[ 51.175285s]vSAILAPPLShelltask_core1: Rx Seq Q SUCCESS -:can -t 5 -c 1
c1[ 51.175313s]can_mcal_test : 422 Entered string : can -t 5 -c 1
c1[ 51.175344s]Invoked CanTC_Write
c1[ 51.276027s]Can_Mb_Sd_CanSrv_Tx_Callback with swPduHandle: 2, Hth: 3, timeStamp.sec:32 timeStamp.ns:179280000
c1[ 51.276072s]CanTest_TxConfirmation with swPduHandle: 2, Hth: 3, timeStamp.sec:32 timeStamp.ns:179280000
c1[ 51.326264s]xCanSrv_Write Successful on object 6 with swPduHandle 2
c1[ 51.326298s]Exiting Can Testapp with return : 0
```
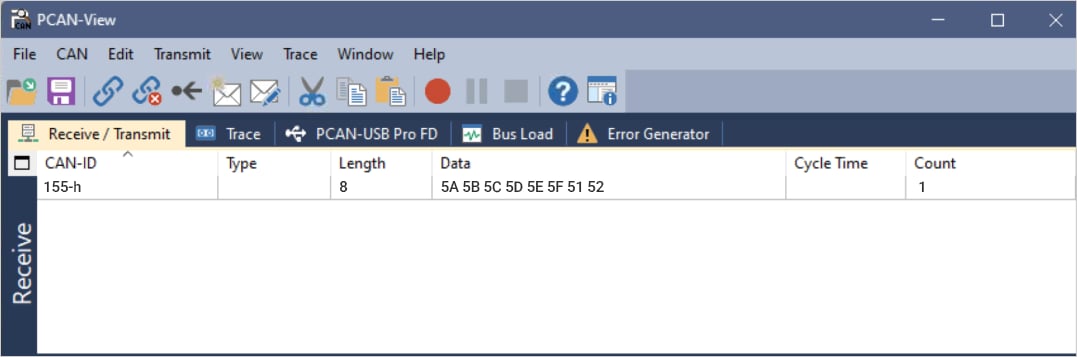
The CAN TX FD data shows up on the PCAN-View application
`can TX - FD ID`
Syntax:
```text theme={null}
can -t 5 -c x
```
Parameters: `x` = CAN controller ID: 0 to 7
Sample logs for `can -t 5 -c 1`
```text theme={null}
c0[ 51.175227s][ UART-CAN ] Queue send for core 1 pass
c1[ 51.175285s]vSAILAPPLShelltask_core1: Rx Seq Q SUCCESS -:can -t 5 -c 1
c1[ 51.175313s]can_mcal_test : 422 Entered string : can -t 5 -c 1
c1[ 51.175344s]Invoked CanTC_Write
c1[ 51.276027s]Can_Mb_Sd_CanSrv_Tx_Callback with swPduHandle: 2, Hth: 3, timeStamp.sec:32 timeStamp.ns:179280000
c1[ 51.276072s]CanTest_TxConfirmation with swPduHandle: 2, Hth: 3, timeStamp.sec:32 timeStamp.ns:179280000
c1[ 51.326264s]xCanSrv_Write Successful on object 6 with swPduHandle 2
c1[ 51.326298s]Exiting Can Testapp with return : 0
```
The CAN TX FD data shows up on the PCAN-View application
 `CAN RX`
To run the CAN RX command, do the following:
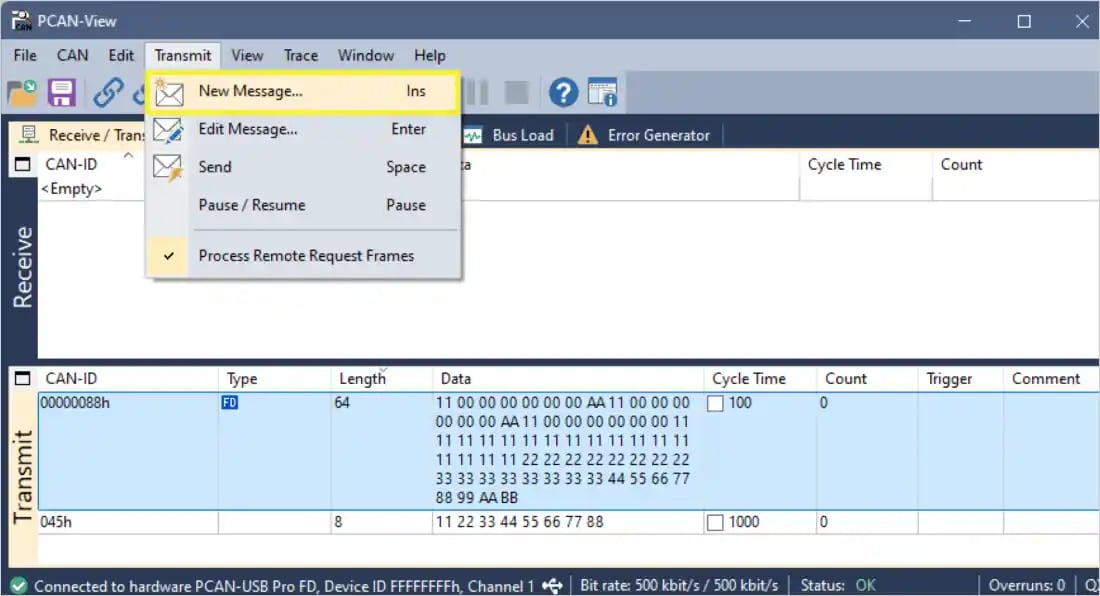
a. Select Transmit > New Message ....
`CAN RX`
To run the CAN RX command, do the following:
a. Select Transmit > New Message ....
 b. On the New Transmit Message window, set the following configurations:
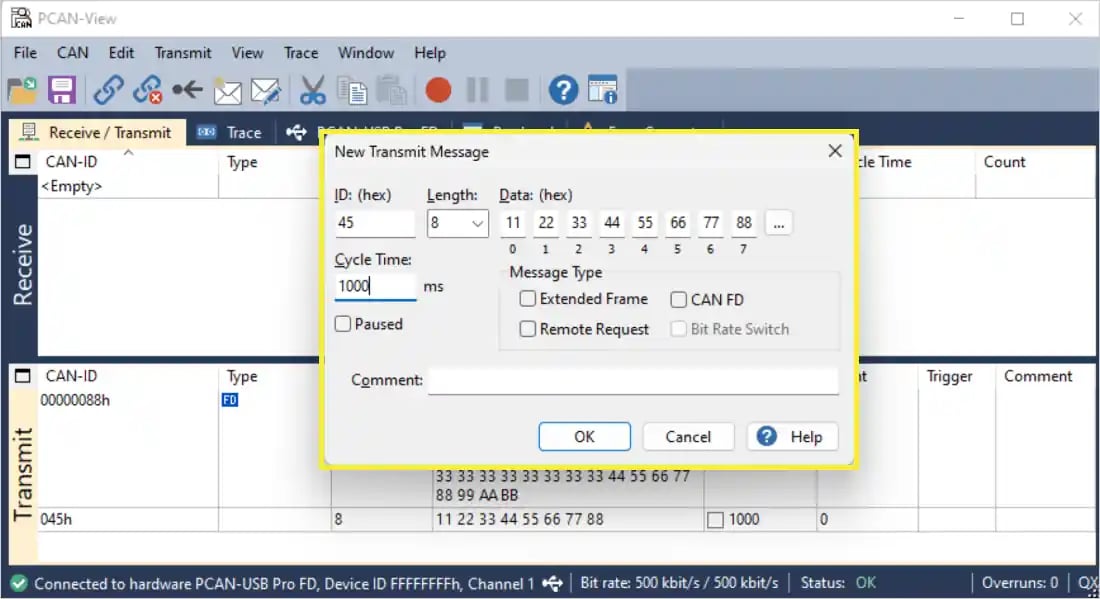 * ID: Enter the CAN ID (For example, 123).
* Length: Set the number of data bytes (8, 12, 32, 64).
* Data: Enter the data bytes (For example, 11 22 33 44 55 66 77 88).
* cycle time : 1000 ms
* under Message Type, ensure to select the **CAN FD** checkbox if it’s a CAN FD frame.
c. Select ok.
d. On the Transmit window, select the **cycle time** checkbox to start sending the message.
* ID: Enter the CAN ID (For example, 123).
* Length: Set the number of data bytes (8, 12, 32, 64).
* Data: Enter the data bytes (For example, 11 22 33 44 55 66 77 88).
* cycle time : 1000 ms
* under Message Type, ensure to select the **CAN FD** checkbox if it’s a CAN FD frame.
c. Select ok.
d. On the Transmit window, select the **cycle time** checkbox to start sending the message.
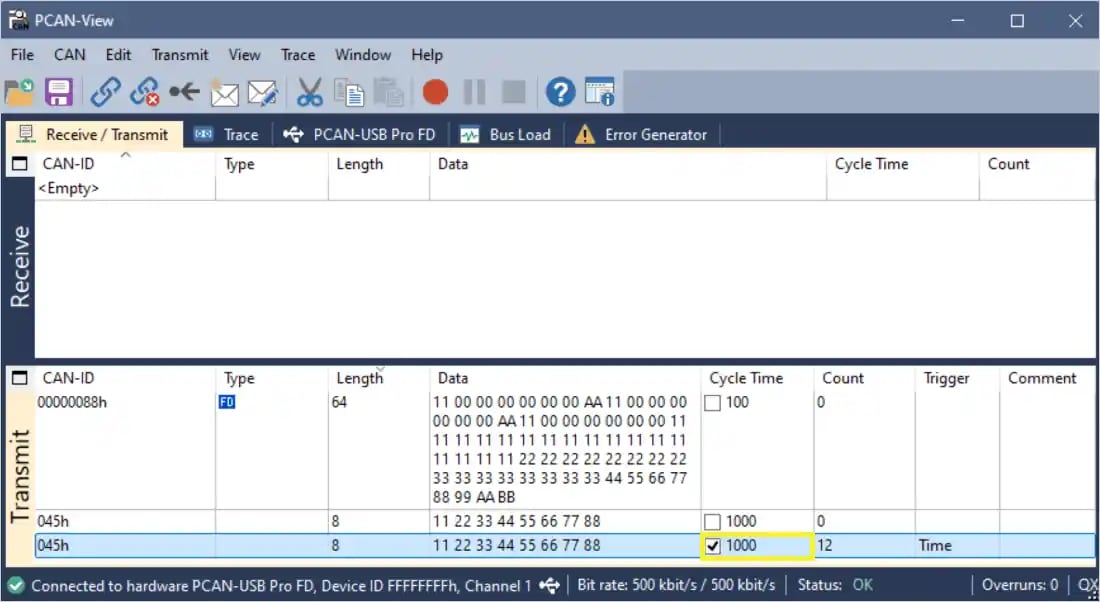 Note
To stop sending the message, unselect the **cycle time**.
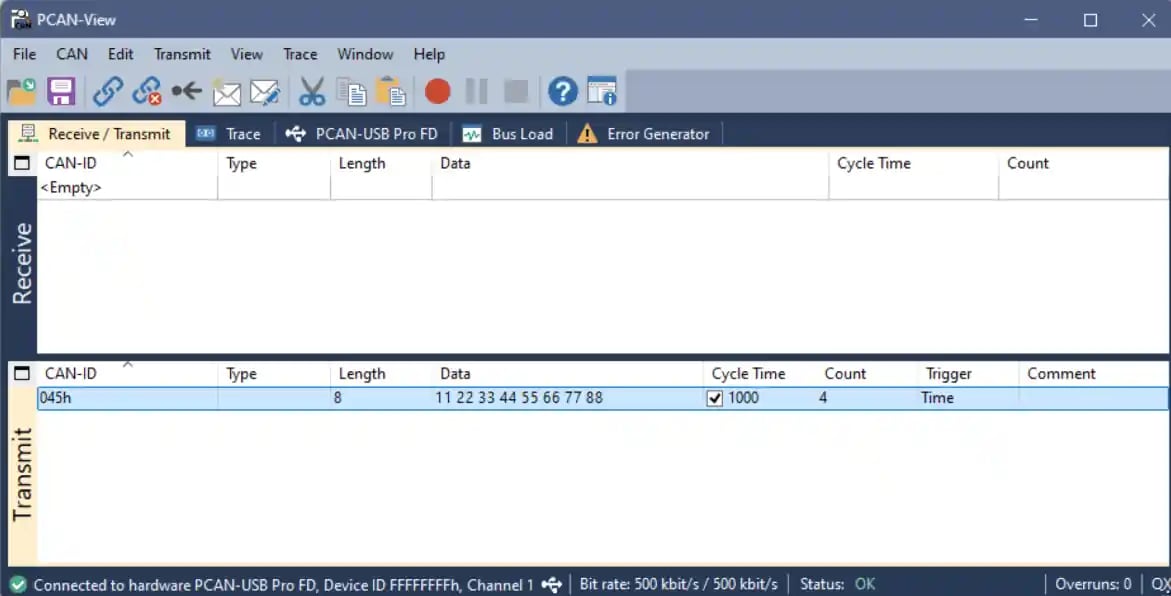
The following figure shows the transmitted message and received logs:
Note
To stop sending the message, unselect the **cycle time**.
The following figure shows the transmitted message and received logs:
 Sample logs for standard CAN:
```text theme={null}
Standard packet
c1[ 57.414398s]CanTest_RxIndication is invoked with:
c1[ 57.414418s]Mailbox-> CanId:0x221
c1[ 57.414438s]Mailbox-> Hoh:8
c1[ 57.414458s]Mailbox-> ControllerId:1
c1[ 57.414479s]timeStamp.sec:38 timeStamp.ns:317740000
c1[ 57.414507s]DataLength:8
c1[ 57.464911s]Can_Mb_Write : success
c1[ 57.464929s]Can_Mb_Write : Controller Id = 1, cmd = 0, len = 8, MsgId : 221
FD packet
c1[ 58.725646s]CanTest_RxIndication is invoked with:
c1[ 58.725666s]Mailbox-> CanId:0x40000450
c1[ 58.725686s]Mailbox-> Hoh:8
c1[ 58.725706s]Mailbox-> ControllerId:1
c1[ 58.725727s]timeStamp.sec:39 timeStamp.ns:628040000
c1[ 58.725755s]DataLength:64
c1[ 58.776816s]Can_Mb_Write : success
c1[ 58.776834s]Can_Mb_Write : Controller Id = 1, cmd = 0, len = 64, MsgId : 40000450
```
### **CAN – HLOS mailbox test commands**
The following are the HLOS mailbox CAN test commands:
#### **Enable sail\_can user-space application**
Run the command to start the sail\_can application to use this feature:
```text theme={null}
sail_can --debug
```
Note
For high performance requirements, --debug must be skipped. Use --debug to print the log messages on the console.
Test case output:
```text theme={null}
[1970-01-03 23:08:39] sail_can INFO DAEMON: Starting sail_can daemon
[1970-01-03 23:08:39] sail_can INFO CONFIG: Loading configuration from /etc/sail_can/sail_can.conf
[1970-01-03 23:08:39] sail_can INFO CONFIG: Controller 0: baud config = 0 (500 kbps nominal, 500 kbps data, BRS disabled)
:::::::::::
[1970-01-03 23:08:39] sail_can INFO CONFIG: Controller 7: baud config = 0 (500 kbps nominal, 500 kbps data, BRS disabled)
[1970-01-03 23:08:39] sail_can INFO CONFIG: Configuration loaded for 8 controller(s) with 0 error(s)
[1970-01-03 23:08:39] sail_can INFO INIT: Initializing daemon components
[1970-01-03 23:08:39] sail_can INFO GATEWAY: Setting up CAN gateway
:::::::::::
[1970-01-03 23:08:40] sail_can INFO GATEWAY: CAN gateway setup completed successfully
[1970-01-03 23:08:40] sail_can INFO INIT: All controllers initialized
[1970-01-03 23:08:40] sail_can INFO DAEMON: Daemon initialized successfully, entering main loop
```
#### **View CAN ports**
Run the command to see all the CAN ports from APSS:
```text theme={null}
ifconfig -a
#all vcan node must be seen
```
Test case output:
**vcan0 Link encap:UNSPEC HWaddr 00-00-00-00-00-00-00-00-00-00-00-00-00-00-00-00**
inet addr:169.254.185.103 Mask:255.255.0.0
**vcan1 Link encap:UNSPEC HWaddr 00-00-00-00-00-00-00-00-00-00-00-00-00-00-00-00**
inet addr:169.254.185.103 Mask:255.255.0.0
**vcan8 Link encap:UNSPEC HWaddr 00-00-00-00-00-00-00-00-00-00-00-00-00-00-00-00**
inet addr:169.254.185.103 Mask:255.255.0.0
**vcan9 Link encap:UNSPEC HWaddr 00-00-00-00-00-00-00-00-00-00-00-00-00-00-00-00**
inet addr:169.254.185.103 Mask:255.255.0.0
wlan0 Link encap:Ethernet HWaddr F6:4F:02:32:74:EA
Note
Edit the active\_controller value at /etc/sail\_can/sail\_can.conf to reflect the actual number of controllers on the device.
Start sail\_can only after editing and saving the conf file.
#### **Bootup CAN port status**
Run the command to update the CAN port status at bootup:
```text theme={null}
sail_can --debug
# This application will quit if there is any issue in mailbox drivers or SAIL FW.
# Waiting for message is indication that all CAN ports are booted up right.
```
Note
Ensure this test sail\_can is running in the background.
#### **Set CAN port baud**
Run the command to configure the CAN node with bit rate per the CAN bus:
```text theme={null}
#edit this file on target -- /etc/sail-can/sail-can.conf
# change the baud as per the known set of baud rates only.
killall -HUP sail_can # this will re-start the sail-can application.
```
#### **Send data**
Run the command to send data on CAN bus and receive using a PCAN analyzer on another end:
```text theme={null}
#data can be sent only on vcan ports
# to send data on CAN port N use vcanN
cansend vcan1 213##311223344 # to send data on CANport 1
cansend vcan7 213##311223344 # to send data on CANport7
```
Test case output:
```text theme={null}
# cansend vcan1 213##3112233
```
```text theme={null}
VCAN Port Mappings
vcan0 → vcan8
vcan1 → vcan9
vcan2 → vcan10
vcan3 → vcan11
vcan4 → vcan12
vcan5 → vcan13
vcan6 → vcan14
vcan7 → vcan15
```
#### **Receive data**
Run the command to receive data from CANutils (candump) on the can port. Data is sent from PCAN or other external device.
```text theme={null}
#data can be received only on vcan ports
# to receive data on CAN port N use vcanN
candump vcan7 # to receive data on Vcan 7
```
Test case output:
```text theme={null}
# candump vcan9
vcan9 213 [04] 11 22 33 44
```
#### **Error CAN**
Send error frame on CAN bus using PCAN analyzer. Use external analysers, such as PCAN, to send error frames.
#### **Send multiple data**
To verify CAN communication using one of the following setups:
* Send data over multiple CAN buses and receive it using a PCAN analyzer.
* Connect two devices through multiple CAN ports and receive data on the corresponding ports.
* Connect multiple CAN ports on the same device to a single CAN bus and transmit/receive data across different CAN ports.
Run the following command:
```text theme={null}
#data can be sent only on vcan ports
# to send data on CAN port N use vcanN
cansend vcan1 213##311223344 # to send data on CANport 1
cansend vcan7 213##311223344 # to send data on CANport7
```
Test case output:
```text theme={null}
Send
sh-5.2# cansend vcan1 213##3112233
sh-5.2# cansend vcan2 213##31122334455
sh-5.2# cansend vcan1 213##31122334455
sh-5.2# cansend vcan2 213##31122334455
Receive
sh-5.2# candump vcan9&
[2] 5497
ssh-5.2# candump vcan10&
[3] 5498
sh-5.2# vcan9 213 [03] 11 22 33
vcan10 213 [05] 11 22 33 44 55
vcan9 213 [05] 11 22 33 44 55
vcan10 213 [05] 11 22 33 44 55
```
#### **Set baud to multiple CAN port**
Run the command to configure the CAN node with bit rate per the CAN bus for more than one CAN port.
```text theme={null}
#edit this file on target -- /etc/sail-can/sail-can.conf
# change the baud as per the known set of baud rates only.
# can change baud of multiple CAN ports at once.
killall -HUP sail_can # this will re-start the sail-can application
```
#### **Receive multiple data**
Run the command to receive data using SOCKETCAN APIs on more than one CAN port:
```text theme={null}
#data can be received only on vcan ports
# to receive data on CAN port N use vcanN
candump vcan7 # to receive data on Vcan 7
candump vcan2 # to receive data on Vcan 2
```
Test case output:
```text theme={null}
Send
sh-5.2# cansend vcan1 213##3112233
sh-5.2# cansend vcan2 213##31122334455
sh-5.2# cansend vcan1 213##31122334455
sh-5.2# cansend vcan2 213##31122334455
Receive
sh-5.2# candump vcan9&
[2] 5497
ssh-5.2# candump vcan10&
[3] 5498
sh-5.2# vcan9 213 [03] 11 22 33
vcan10 213 [05] 11 22 33 44 55
vcan9 213 [05] 11 22 33 44 55
vcan10 213 [05] 11 22 33 44 55
```
## **Mailbox test applications**
### **Prerequisites**
Before running mailbox test applications:
1. Update SELinux configuration:
1. Change `SELINUX=enforcing` to `SELINUX=permissive` in the `/etc/selinux/config` file.
2. Verify the updated configuration:
```text theme={null}
cat /etc/selinux/config
```
Sample output:
```text theme={null}
# This file controls the state of SELinux on the system.
# SELINUX= can take one of these three values:
# enforcing - SELinux security policy is enforced.
# permissive - SELinux prints warnings instead of enforcing.
# disabled - No SELinux policy is loaded.
SELINUX=permissive
# SELINUXTYPE= can take one of these values:
# minimum - Minimum Security protection.
# standard - Standard Security protection.
# mls - Multi Level Security protection.
# targeted - Targeted processes are protected.
# mcs - Multi Category Security protection.
SELINUXTYPE=targeted
```
2. Reboot the device by running the following command either in the ADB shell or in the UART shell:
```text theme={null}
reboot
```
### **Check mailbox driver status**
1. Run the following command to verify that the mailbox driver is initialized:
```text theme={null}
dmesg | grep mailbox
```
Sample output:
```text theme={null}
root@qcs9075-iq-9075-evk:~# dmesg | grep mailbox
[ 0.000000] OF: reserved mem: 0x0000000090c00000..0x0000000090cfffff (1024 KiB) nomap non-reusable tz-sail-mailbox@90c00000
[ 4.016720] sail_mailbox 1ffe02c.sail-mailbox: mbox initialization successful !!!!
[ 4.089167] sail_mailbox 1ffe02c.sail-mailbox: sail mailbox ready !!!!
```
2. Verify device node:
```text theme={null}
ls /dev/sailMB
```
Sample output:
/dev/sailMB
### **sail\_console\_chan\_app**
1. Run the following command in the APSS UART shell:
```text theme={null}
sail_console_chan_app
```
Sample output:
```text theme={null}
ret(0x2EC88FF0), time_consumed(1560us)
h0[ 0.706105s]nElfLoaderVerifySwiv: SWIV - Image Verification Success for SW Image = 0x55
h0[ 0.706137s]Security::Auth::sail_sec_img_auth_hash_elf_segments: Entry, sec_img_id(0x55)
h0[ 0.708887s]Security::Auth::sail_sec_img_auth_hash_elf_segments: Exit, sec_img_id(0x55), ret(0x2EC88FF0), time_consumed(2720us)
h0[ 0.708956s]xStorageClose: handle = 0x70000
c0[ 60.025908s]sail_proc@home$
```
Note
The `sail_console_chan_app` test application emulates (acts like) the RTSS UART console shell.
### **saildbg**
**I²C testing**
* Run the following command in APSS UART shell:
```text theme={null}
saildbg -r /dev/sail/tst1 -c 0x30 -l 0x3 -p 0xA3 0xF0 0x01
```
* Sample logs:
* APSS side:
```text theme={null}
saildbg: write poll event…
saildbg: dump==>
crc:0x00
::::::
rsv:0x00
d[] dump =>
d[000] | d[001] | d[002] |
0x0A3 | 0x0F0 | 0x001 |
saildbg: read poll event …
saildbg: dump==>
crc:0x00
::::::
rsv:0x00
d[] dump => d[000] | d[001] | d[002] | d[003] |
0x0A3 | 0x0F0 | 0x001 | 0x001 |
```
* RTSS side:
```text theme={null}
c0[ 196.506702s] I2C Test Cases Started
c0[ 196.536737s] Psail 0–3 Revid: 0x51 0x4f | WRITE: 0x48 | READ: 0x48
c0[ 196.706776s] TC_I2C_07: PSAIL Passed
c0[ 196.707605s] TC_I2C_08: I2C DeInit Success—Passed
c0[ 196.757855s] TC_I2C_09: I2C Init-DeInit with Invalid HWID Passed
c0[ 196.809070s] TC_I2C_010: I2C Init Success—Passed
c0[ 196.809135s] [I2C tests Passed]
```
**SPI testing**
* Run the following command in APSS UART shell:
```text theme={null}
saildbg -r /dev/sail/tst1 -c 0x30 -l 0x3 -p 0xA5 0xF0 0x01
```
* Sample logs:
* APSS side:
```text theme={null}
saildbg: write poll event…
saildbg: dump==>
crc:0x00
:::::::
rsv:0x00
d[] dump =>
d[000] | d[001] | d[002] |
0x0A5 | 0x0F0 | 0x001 |
saildbg: read poll event …
saildbg: dump==>
crc:0xFF
::::::::
rsv:0x00
d[] dump =>
d[000] | d[001] | d[002] |
0x0A5 | 0x0F0 | 0x001 |
```
* RTSS side:
```text theme={null}
c0[ 778.885969s]---> SPI case -:136814492
c1[ 778.886080s]vSAILAPPLShelltask_core1: Rx Seq Q SUCCESS -:spi
c1[ 778.886108s]Spi_SetupEB : 369 END
c1[ 778.886238s][TC_SPI_001]: Test Synchronous transmission in Loopback mode - Passed
c1[ 778.886265s][SPI] All Test Cases are Passed
```
Note
The failure of TC\_I2C\_09 is expected, as it is intended to validate negative test scenarios.
### **mailbox**
The `mailbox` command executes the functional testcases to evaluate the external mailbox performance. Reboot the system after the test is completed.
Note
Run the `mailbox` command in the RTSS UART console.
```text theme={null}
mailbox
```
```text theme={null}
c0[ 123.277065s] sail_proc@home$
c0[ 126.620396s] Mailbox Test Cases Started
c0[ 126.620535s] slMailBox_DeInit(0): success, status 0
c0[ 126.620687s] TC_MB_01 Pass
::::::::
c0[ 126.621854s] TC_MB_19–25 Pass
c0[ 126.622166s] Mailbox All Test Case Passed!
c0[ 126.622211s] Restart the System…!
```
### **sailmb\_demo**
Run the application from the APSS UART shell:
```text theme={null}
sailmb_demo [OPTIONS]
```
The application supports the following options:
| **Option** | **Description** |
| :-: | :-: |
| -s \ | Specifies the message to send to RTSS. The maximum message size is 64 bytes, including the null terminator. The default message is “Hello From MD!”. |
| -n \ | Specifies the number of message exchanges. In single-core mode, the value is the number of exchanges with the selected core. The default value is 1. |
| -c \ | Selects RTSS core 0, 1, 2, or 3. The core can also be specified in hexadecimal format, such as 0x3. |
| -h | Displays command help and exits. |
**Example scenarios:**
* Send multiple messages to a core.
The following command sends the default message 10 times to Core 1:
```text theme={null}
sailmb_demo -c 1 -n 10
```
Sample output:
* APSS side:
```text theme={null}
===== Running Application =====
Selected Core : 1
Input String : Hello From MD!
Iterations : 10
1: opened Tx
1: opened Rx
1 Recd: >Hi MD! From SAIL C1 -Hello From MD! (1)-<
::::::
10 Recd: >Hi MD! From SAIL C1 -Hello From MD! (10)-<
1: closed Tx
1: closed Rx
[INFO] Cleanup complete
[INFO] Exit..
```
* RTSS side:
```text theme={null}
c1[ 44.689062s]xCore1Task:Rcvd >Hello From MD! (1)<
c1[ 44.892065s]xCore1Task:Rcvd >Hello From MD! (2)<
::::::
c1[ 46.514491s]xCore1Task:Rcvd >Hello From MD! (10)<
```
* Send a custom message.
The following command sends *Ping from Linux* 10 times to Core 2:
```text theme={null}
sailmb_demo -s "Ping from Linux" -n 10 -c 2
```
Sample output:
* APSS side:
```text theme={null}
===== Running Application =====
Selected Core : 2
Input String : Ping from Linux
Iterations : 10
2: opened Tx
2: opened Rx
1 Recd: >Hi MD! From SAIL C2 -Ping from Linux (1)-<
::::::
10 Recd: >Hi MD! From SAIL C2 -Ping from Linux (10)-<
2: closed Tx
2: closed Rx
[INFO] Cleanup complete
[INFO] Exit..
```
* RTSS side:
```text theme={null}
c2[ 54.335216s]xCore2Task:Rcvd >Ping from Linux (1)<
c0[ 54.335578s] ==== Core 2 out of sleep ====
c2[ 54.355895s][WDT] Watchdog enabled on core 0 cluster-: 1
c2[ 54.355956s][WDT] Petting Queuesend success with time-: 55000 core-:2
c2[ 54.355989s][WDT] : Core_2 wdt enable performed
c2[ 54.538501s]xCore2Task:Rcvd >Ping from Linux (2)<
::::::
c2[ 56.158697s]xCore2Task:Rcvd >Ping from Linux (10)<
```
* Specify the core in hexadecimal format.
The following command sends *Testing Core 3* five times to Core 3:
```text theme={null}
sailmb_demo -c 0x3 -s "Testing Core 3" -n 5
```
Sample output:
* APSS side:
```text theme={null}
===== Running Application =====
Selected Core : 3
Input String : Testing Core 3
Iterations : 5
3: opened Tx
3: opened Rx
1 Recd: >Hi MD! From SAIL C3 -Testing Core 3 (1)-<
::::::
5 Recd: >Hi MD! From SAIL C3 -Testing Core 3 (5)-<
3: closed Tx
3: closed Rx
[INFO] Cleanup complete
[INFO] Exit..
```
* RTSS side:
```text theme={null}
c3[ 69.235518s]xCore3Task:Rcvd >Testing Core 3 (1)<
c0[ 69.235995s] ==== Core 3 out of sleep ====
c3[ 69.256181s][WDT] Watchdog enabled on core 1 cluster-: 1
c3[ 69.256244s][WDT] Petting Queuesend success with time-: 55000 core-:3
c3[ 69.256277s][WDT] : Core_3 wdt enable performed
c3[ 69.256464s] [ WDT ] Petting started for core 3
c3[ 69.438289s]xCore3Task:Rcvd >Testing Core 3 (2)<
c3[ 69.640301s]xCore3Task:Rcvd >Testing Core 3 (3)<
c3[ 69.843896s]xCore3Task:Rcvd >Testing Core 3 (4)<
c3[ 70.046654s]xCore3Task:Rcvd >Testing Core 3 (5)<
```
Each received message identifies the responding RTSS core and includes the original message. Use this information to verify that the selected core processed every message.
## **Ethernet test commands**
### **View the interface configuration**
When the device is connected to a public network, the Dynamic Host Configuration Protocol (DHCP) automatically assigns an IP address to the RTSS Ethernet interface.
Run the following command to view the assigned IP address, subnet mask, gateway, MAC address, and Ethernet link status:
```text theme={null}
nw ifconfig
```
Sample output:
\[NW] ifconfig: link=UP
Sample logs for standard CAN:
```text theme={null}
Standard packet
c1[ 57.414398s]CanTest_RxIndication is invoked with:
c1[ 57.414418s]Mailbox-> CanId:0x221
c1[ 57.414438s]Mailbox-> Hoh:8
c1[ 57.414458s]Mailbox-> ControllerId:1
c1[ 57.414479s]timeStamp.sec:38 timeStamp.ns:317740000
c1[ 57.414507s]DataLength:8
c1[ 57.464911s]Can_Mb_Write : success
c1[ 57.464929s]Can_Mb_Write : Controller Id = 1, cmd = 0, len = 8, MsgId : 221
FD packet
c1[ 58.725646s]CanTest_RxIndication is invoked with:
c1[ 58.725666s]Mailbox-> CanId:0x40000450
c1[ 58.725686s]Mailbox-> Hoh:8
c1[ 58.725706s]Mailbox-> ControllerId:1
c1[ 58.725727s]timeStamp.sec:39 timeStamp.ns:628040000
c1[ 58.725755s]DataLength:64
c1[ 58.776816s]Can_Mb_Write : success
c1[ 58.776834s]Can_Mb_Write : Controller Id = 1, cmd = 0, len = 64, MsgId : 40000450
```
### **CAN – HLOS mailbox test commands**
The following are the HLOS mailbox CAN test commands:
#### **Enable sail\_can user-space application**
Run the command to start the sail\_can application to use this feature:
```text theme={null}
sail_can --debug
```
Note
For high performance requirements, --debug must be skipped. Use --debug to print the log messages on the console.
Test case output:
```text theme={null}
[1970-01-03 23:08:39] sail_can INFO DAEMON: Starting sail_can daemon
[1970-01-03 23:08:39] sail_can INFO CONFIG: Loading configuration from /etc/sail_can/sail_can.conf
[1970-01-03 23:08:39] sail_can INFO CONFIG: Controller 0: baud config = 0 (500 kbps nominal, 500 kbps data, BRS disabled)
:::::::::::
[1970-01-03 23:08:39] sail_can INFO CONFIG: Controller 7: baud config = 0 (500 kbps nominal, 500 kbps data, BRS disabled)
[1970-01-03 23:08:39] sail_can INFO CONFIG: Configuration loaded for 8 controller(s) with 0 error(s)
[1970-01-03 23:08:39] sail_can INFO INIT: Initializing daemon components
[1970-01-03 23:08:39] sail_can INFO GATEWAY: Setting up CAN gateway
:::::::::::
[1970-01-03 23:08:40] sail_can INFO GATEWAY: CAN gateway setup completed successfully
[1970-01-03 23:08:40] sail_can INFO INIT: All controllers initialized
[1970-01-03 23:08:40] sail_can INFO DAEMON: Daemon initialized successfully, entering main loop
```
#### **View CAN ports**
Run the command to see all the CAN ports from APSS:
```text theme={null}
ifconfig -a
#all vcan node must be seen
```
Test case output:
**vcan0 Link encap:UNSPEC HWaddr 00-00-00-00-00-00-00-00-00-00-00-00-00-00-00-00**
inet addr:169.254.185.103 Mask:255.255.0.0
**vcan1 Link encap:UNSPEC HWaddr 00-00-00-00-00-00-00-00-00-00-00-00-00-00-00-00**
inet addr:169.254.185.103 Mask:255.255.0.0
**vcan8 Link encap:UNSPEC HWaddr 00-00-00-00-00-00-00-00-00-00-00-00-00-00-00-00**
inet addr:169.254.185.103 Mask:255.255.0.0
**vcan9 Link encap:UNSPEC HWaddr 00-00-00-00-00-00-00-00-00-00-00-00-00-00-00-00**
inet addr:169.254.185.103 Mask:255.255.0.0
wlan0 Link encap:Ethernet HWaddr F6:4F:02:32:74:EA
Note
Edit the active\_controller value at /etc/sail\_can/sail\_can.conf to reflect the actual number of controllers on the device.
Start sail\_can only after editing and saving the conf file.
#### **Bootup CAN port status**
Run the command to update the CAN port status at bootup:
```text theme={null}
sail_can --debug
# This application will quit if there is any issue in mailbox drivers or SAIL FW.
# Waiting for message is indication that all CAN ports are booted up right.
```
Note
Ensure this test sail\_can is running in the background.
#### **Set CAN port baud**
Run the command to configure the CAN node with bit rate per the CAN bus:
```text theme={null}
#edit this file on target -- /etc/sail-can/sail-can.conf
# change the baud as per the known set of baud rates only.
killall -HUP sail_can # this will re-start the sail-can application.
```
#### **Send data**
Run the command to send data on CAN bus and receive using a PCAN analyzer on another end:
```text theme={null}
#data can be sent only on vcan ports
# to send data on CAN port N use vcanN
cansend vcan1 213##311223344 # to send data on CANport 1
cansend vcan7 213##311223344 # to send data on CANport7
```
Test case output:
```text theme={null}
# cansend vcan1 213##3112233
```
```text theme={null}
VCAN Port Mappings
vcan0 → vcan8
vcan1 → vcan9
vcan2 → vcan10
vcan3 → vcan11
vcan4 → vcan12
vcan5 → vcan13
vcan6 → vcan14
vcan7 → vcan15
```
#### **Receive data**
Run the command to receive data from CANutils (candump) on the can port. Data is sent from PCAN or other external device.
```text theme={null}
#data can be received only on vcan ports
# to receive data on CAN port N use vcanN
candump vcan7 # to receive data on Vcan 7
```
Test case output:
```text theme={null}
# candump vcan9
vcan9 213 [04] 11 22 33 44
```
#### **Error CAN**
Send error frame on CAN bus using PCAN analyzer. Use external analysers, such as PCAN, to send error frames.
#### **Send multiple data**
To verify CAN communication using one of the following setups:
* Send data over multiple CAN buses and receive it using a PCAN analyzer.
* Connect two devices through multiple CAN ports and receive data on the corresponding ports.
* Connect multiple CAN ports on the same device to a single CAN bus and transmit/receive data across different CAN ports.
Run the following command:
```text theme={null}
#data can be sent only on vcan ports
# to send data on CAN port N use vcanN
cansend vcan1 213##311223344 # to send data on CANport 1
cansend vcan7 213##311223344 # to send data on CANport7
```
Test case output:
```text theme={null}
Send
sh-5.2# cansend vcan1 213##3112233
sh-5.2# cansend vcan2 213##31122334455
sh-5.2# cansend vcan1 213##31122334455
sh-5.2# cansend vcan2 213##31122334455
Receive
sh-5.2# candump vcan9&
[2] 5497
ssh-5.2# candump vcan10&
[3] 5498
sh-5.2# vcan9 213 [03] 11 22 33
vcan10 213 [05] 11 22 33 44 55
vcan9 213 [05] 11 22 33 44 55
vcan10 213 [05] 11 22 33 44 55
```
#### **Set baud to multiple CAN port**
Run the command to configure the CAN node with bit rate per the CAN bus for more than one CAN port.
```text theme={null}
#edit this file on target -- /etc/sail-can/sail-can.conf
# change the baud as per the known set of baud rates only.
# can change baud of multiple CAN ports at once.
killall -HUP sail_can # this will re-start the sail-can application
```
#### **Receive multiple data**
Run the command to receive data using SOCKETCAN APIs on more than one CAN port:
```text theme={null}
#data can be received only on vcan ports
# to receive data on CAN port N use vcanN
candump vcan7 # to receive data on Vcan 7
candump vcan2 # to receive data on Vcan 2
```
Test case output:
```text theme={null}
Send
sh-5.2# cansend vcan1 213##3112233
sh-5.2# cansend vcan2 213##31122334455
sh-5.2# cansend vcan1 213##31122334455
sh-5.2# cansend vcan2 213##31122334455
Receive
sh-5.2# candump vcan9&
[2] 5497
ssh-5.2# candump vcan10&
[3] 5498
sh-5.2# vcan9 213 [03] 11 22 33
vcan10 213 [05] 11 22 33 44 55
vcan9 213 [05] 11 22 33 44 55
vcan10 213 [05] 11 22 33 44 55
```
## **Mailbox test applications**
### **Prerequisites**
Before running mailbox test applications:
1. Update SELinux configuration:
1. Change `SELINUX=enforcing` to `SELINUX=permissive` in the `/etc/selinux/config` file.
2. Verify the updated configuration:
```text theme={null}
cat /etc/selinux/config
```
Sample output:
```text theme={null}
# This file controls the state of SELinux on the system.
# SELINUX= can take one of these three values:
# enforcing - SELinux security policy is enforced.
# permissive - SELinux prints warnings instead of enforcing.
# disabled - No SELinux policy is loaded.
SELINUX=permissive
# SELINUXTYPE= can take one of these values:
# minimum - Minimum Security protection.
# standard - Standard Security protection.
# mls - Multi Level Security protection.
# targeted - Targeted processes are protected.
# mcs - Multi Category Security protection.
SELINUXTYPE=targeted
```
2. Reboot the device by running the following command either in the ADB shell or in the UART shell:
```text theme={null}
reboot
```
### **Check mailbox driver status**
1. Run the following command to verify that the mailbox driver is initialized:
```text theme={null}
dmesg | grep mailbox
```
Sample output:
```text theme={null}
root@qcs9075-iq-9075-evk:~# dmesg | grep mailbox
[ 0.000000] OF: reserved mem: 0x0000000090c00000..0x0000000090cfffff (1024 KiB) nomap non-reusable tz-sail-mailbox@90c00000
[ 4.016720] sail_mailbox 1ffe02c.sail-mailbox: mbox initialization successful !!!!
[ 4.089167] sail_mailbox 1ffe02c.sail-mailbox: sail mailbox ready !!!!
```
2. Verify device node:
```text theme={null}
ls /dev/sailMB
```
Sample output:
/dev/sailMB
### **sail\_console\_chan\_app**
1. Run the following command in the APSS UART shell:
```text theme={null}
sail_console_chan_app
```
Sample output:
```text theme={null}
ret(0x2EC88FF0), time_consumed(1560us)
h0[ 0.706105s]nElfLoaderVerifySwiv: SWIV - Image Verification Success for SW Image = 0x55
h0[ 0.706137s]Security::Auth::sail_sec_img_auth_hash_elf_segments: Entry, sec_img_id(0x55)
h0[ 0.708887s]Security::Auth::sail_sec_img_auth_hash_elf_segments: Exit, sec_img_id(0x55), ret(0x2EC88FF0), time_consumed(2720us)
h0[ 0.708956s]xStorageClose: handle = 0x70000
c0[ 60.025908s]sail_proc@home$
```
Note
The `sail_console_chan_app` test application emulates (acts like) the RTSS UART console shell.
### **saildbg**
**I²C testing**
* Run the following command in APSS UART shell:
```text theme={null}
saildbg -r /dev/sail/tst1 -c 0x30 -l 0x3 -p 0xA3 0xF0 0x01
```
* Sample logs:
* APSS side:
```text theme={null}
saildbg: write poll event…
saildbg: dump==>
crc:0x00
::::::
rsv:0x00
d[] dump =>
d[000] | d[001] | d[002] |
0x0A3 | 0x0F0 | 0x001 |
saildbg: read poll event …
saildbg: dump==>
crc:0x00
::::::
rsv:0x00
d[] dump => d[000] | d[001] | d[002] | d[003] |
0x0A3 | 0x0F0 | 0x001 | 0x001 |
```
* RTSS side:
```text theme={null}
c0[ 196.506702s] I2C Test Cases Started
c0[ 196.536737s] Psail 0–3 Revid: 0x51 0x4f | WRITE: 0x48 | READ: 0x48
c0[ 196.706776s] TC_I2C_07: PSAIL Passed
c0[ 196.707605s] TC_I2C_08: I2C DeInit Success—Passed
c0[ 196.757855s] TC_I2C_09: I2C Init-DeInit with Invalid HWID Passed
c0[ 196.809070s] TC_I2C_010: I2C Init Success—Passed
c0[ 196.809135s] [I2C tests Passed]
```
**SPI testing**
* Run the following command in APSS UART shell:
```text theme={null}
saildbg -r /dev/sail/tst1 -c 0x30 -l 0x3 -p 0xA5 0xF0 0x01
```
* Sample logs:
* APSS side:
```text theme={null}
saildbg: write poll event…
saildbg: dump==>
crc:0x00
:::::::
rsv:0x00
d[] dump =>
d[000] | d[001] | d[002] |
0x0A5 | 0x0F0 | 0x001 |
saildbg: read poll event …
saildbg: dump==>
crc:0xFF
::::::::
rsv:0x00
d[] dump =>
d[000] | d[001] | d[002] |
0x0A5 | 0x0F0 | 0x001 |
```
* RTSS side:
```text theme={null}
c0[ 778.885969s]---> SPI case -:136814492
c1[ 778.886080s]vSAILAPPLShelltask_core1: Rx Seq Q SUCCESS -:spi
c1[ 778.886108s]Spi_SetupEB : 369 END
c1[ 778.886238s][TC_SPI_001]: Test Synchronous transmission in Loopback mode - Passed
c1[ 778.886265s][SPI] All Test Cases are Passed
```
Note
The failure of TC\_I2C\_09 is expected, as it is intended to validate negative test scenarios.
### **mailbox**
The `mailbox` command executes the functional testcases to evaluate the external mailbox performance. Reboot the system after the test is completed.
Note
Run the `mailbox` command in the RTSS UART console.
```text theme={null}
mailbox
```
```text theme={null}
c0[ 123.277065s] sail_proc@home$
c0[ 126.620396s] Mailbox Test Cases Started
c0[ 126.620535s] slMailBox_DeInit(0): success, status 0
c0[ 126.620687s] TC_MB_01 Pass
::::::::
c0[ 126.621854s] TC_MB_19–25 Pass
c0[ 126.622166s] Mailbox All Test Case Passed!
c0[ 126.622211s] Restart the System…!
```
### **sailmb\_demo**
Run the application from the APSS UART shell:
```text theme={null}
sailmb_demo [OPTIONS]
```
The application supports the following options:
| **Option** | **Description** |
| :-: | :-: |
| -s \ | Specifies the message to send to RTSS. The maximum message size is 64 bytes, including the null terminator. The default message is “Hello From MD!”. |
| -n \ | Specifies the number of message exchanges. In single-core mode, the value is the number of exchanges with the selected core. The default value is 1. |
| -c \ | Selects RTSS core 0, 1, 2, or 3. The core can also be specified in hexadecimal format, such as 0x3. |
| -h | Displays command help and exits. |
**Example scenarios:**
* Send multiple messages to a core.
The following command sends the default message 10 times to Core 1:
```text theme={null}
sailmb_demo -c 1 -n 10
```
Sample output:
* APSS side:
```text theme={null}
===== Running Application =====
Selected Core : 1
Input String : Hello From MD!
Iterations : 10
1: opened Tx
1: opened Rx
1 Recd: >Hi MD! From SAIL C1 -Hello From MD! (1)-<
::::::
10 Recd: >Hi MD! From SAIL C1 -Hello From MD! (10)-<
1: closed Tx
1: closed Rx
[INFO] Cleanup complete
[INFO] Exit..
```
* RTSS side:
```text theme={null}
c1[ 44.689062s]xCore1Task:Rcvd >Hello From MD! (1)<
c1[ 44.892065s]xCore1Task:Rcvd >Hello From MD! (2)<
::::::
c1[ 46.514491s]xCore1Task:Rcvd >Hello From MD! (10)<
```
* Send a custom message.
The following command sends *Ping from Linux* 10 times to Core 2:
```text theme={null}
sailmb_demo -s "Ping from Linux" -n 10 -c 2
```
Sample output:
* APSS side:
```text theme={null}
===== Running Application =====
Selected Core : 2
Input String : Ping from Linux
Iterations : 10
2: opened Tx
2: opened Rx
1 Recd: >Hi MD! From SAIL C2 -Ping from Linux (1)-<
::::::
10 Recd: >Hi MD! From SAIL C2 -Ping from Linux (10)-<
2: closed Tx
2: closed Rx
[INFO] Cleanup complete
[INFO] Exit..
```
* RTSS side:
```text theme={null}
c2[ 54.335216s]xCore2Task:Rcvd >Ping from Linux (1)<
c0[ 54.335578s] ==== Core 2 out of sleep ====
c2[ 54.355895s][WDT] Watchdog enabled on core 0 cluster-: 1
c2[ 54.355956s][WDT] Petting Queuesend success with time-: 55000 core-:2
c2[ 54.355989s][WDT] : Core_2 wdt enable performed
c2[ 54.538501s]xCore2Task:Rcvd >Ping from Linux (2)<
::::::
c2[ 56.158697s]xCore2Task:Rcvd >Ping from Linux (10)<
```
* Specify the core in hexadecimal format.
The following command sends *Testing Core 3* five times to Core 3:
```text theme={null}
sailmb_demo -c 0x3 -s "Testing Core 3" -n 5
```
Sample output:
* APSS side:
```text theme={null}
===== Running Application =====
Selected Core : 3
Input String : Testing Core 3
Iterations : 5
3: opened Tx
3: opened Rx
1 Recd: >Hi MD! From SAIL C3 -Testing Core 3 (1)-<
::::::
5 Recd: >Hi MD! From SAIL C3 -Testing Core 3 (5)-<
3: closed Tx
3: closed Rx
[INFO] Cleanup complete
[INFO] Exit..
```
* RTSS side:
```text theme={null}
c3[ 69.235518s]xCore3Task:Rcvd >Testing Core 3 (1)<
c0[ 69.235995s] ==== Core 3 out of sleep ====
c3[ 69.256181s][WDT] Watchdog enabled on core 1 cluster-: 1
c3[ 69.256244s][WDT] Petting Queuesend success with time-: 55000 core-:3
c3[ 69.256277s][WDT] : Core_3 wdt enable performed
c3[ 69.256464s] [ WDT ] Petting started for core 3
c3[ 69.438289s]xCore3Task:Rcvd >Testing Core 3 (2)<
c3[ 69.640301s]xCore3Task:Rcvd >Testing Core 3 (3)<
c3[ 69.843896s]xCore3Task:Rcvd >Testing Core 3 (4)<
c3[ 70.046654s]xCore3Task:Rcvd >Testing Core 3 (5)<
```
Each received message identifies the responding RTSS core and includes the original message. Use this information to verify that the selected core processed every message.
## **Ethernet test commands**
### **View the interface configuration**
When the device is connected to a public network, the Dynamic Host Configuration Protocol (DHCP) automatically assigns an IP address to the RTSS Ethernet interface.
Run the following command to view the assigned IP address, subnet mask, gateway, MAC address, and Ethernet link status:
```text theme={null}
nw ifconfig
```
Sample output:
\[NW] ifconfig: link=UP
\[NW] ipv4 192.168.200.20 up=1 dhcp=1
\[NW] mask 255.255.255.0
\[NW] gw 192.168.200.10
\[NW] mac e8:e0:b7:b5:7d:e1
\[NW] ipv6 fe80::eae0:b7ff:feb5:7de1 up=1
### **Set static IPv4 configuration**
Run the following command to apply a static IPv4 configuration to the Ethernet device:
```text theme={null}
nw ifconfig set
```
Parameters:
* ``: Static IPv4 address to assign to the RTSS Ethernet interface.
* ``: Subnet mask for the assigned IPv4 address.
* ``: Default gateway IP address used to reach devices outside the local subnet.
Example:
```text theme={null}
nw ifconfig set 192.168.1.100 255.255.255.0 192.168.1.1
```
Sample output:
```text theme={null}
[NW] ifconfig set: applied ip=192.168.1.100
[NW] mask=255.255.255.0
[NW] gw=192.168.1.1
```
### **View network statistics**
Use the following command to display network buffer and heap counters:
```text theme={null}
nw stats
```
Sample output:
```text theme={null}
[NW] stats:
[NW] net buffers: free=30 min=29
[NW] heap: free=40856 min_ever=32416 bytes
[NW] ip-queue stats: disabled (ipconfigCHECK_IP_QUEUE_SPACE=0)
[NW] note: EMAC TX/RX packet counters not exposed by driver
```
Key metrics:
* net buffers: min—if this reaches 0, packet drops may occur.
* heap: min\_ever—if this approaches 0, memory pressure exists.
### **Run a ping test**
Run the following command to send ICMP echo requests to a remote host and confirm data connectivity:
```text theme={null}
nw ping -c
```
Parameters:
``: Link partner IP address ``: Number of probes. The default value is 4, and the maximum supported value is 32.
Example:
```text theme={null}
nw ping 192.168.200.10 -c 4
```
Sample output:
```text theme={null}
[NW] ping 192.168.200.10: 4 probe(s)
[NW] [1] reply
[NW] [2] reply
[NW] [3] reply
[NW] [4] reply
[NW] ping 192.168.200.10: 4/4 replies
```
### **Testing network protocols**
The following figure shows the high-level client/server connection used to validate Ethernet communication between the IQ-9075 target and a connected host. RTSS on the target uses the FreeRTOS TCP/UDP network stack and Ethernet interface to exchange data with the host over a standard Ethernet link. This setup supports TCP client/server testing and UDP packet transmission to verify network connectivity or protocol functionality.
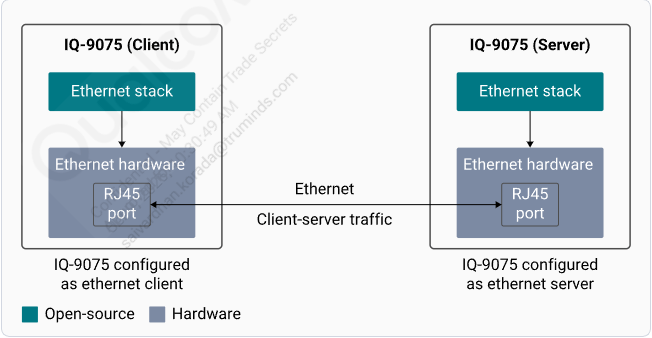 **High-level IQ-9075 client/server connection**
**TCP test**
To perform a TCP test, start the server by running the following command:
```text theme={null}
nw server start [port]
```
Example:
```text theme={null}
nw server start 7777
```
Run the following command to do the TCP test:
```text theme={null}
nw tcp connect
```
```text theme={null}
nw tcp send
```
```text theme={null}
nw tcp close
```
Parameters:
* ``: IP address of the remote TCP server.
* ``: Port number on the remote TCP server.
* ``: Data payload to send over the active TCP connection.
Example:
```text theme={null}
nw tcp connect 192.168.200.10 7777
```
```text theme={null}
nw tcp send hello
```
```text theme={null}
nw tcp close
```
**UDP test**
Run the following command to do the UDP test:
```text theme={null}
nw udp send [size]
```
Parameters:
* ``: IPv4 address of the remote host.
* ``: Port number on the remote host.
* `[size]`: packet payload size, in bytes.
Example:
```text theme={null}
sail_proc@home$ nw udp send 192.168.200.10 9999 32
```
## **Watchdog test commands**
By default, Watchdog is enabled after device bootup. Watchdog enable and disable commands provide feasibility for debugging the software faults. To run the RTSS watchdog commands, do the [Prerequisites](https://dragonwingdocs.qualcomm.com/System/FreeRTOS/RTSS-test-commands#prerequisites-2).
### **Disable all watchdogs**
The `wdg disable` command disables all four cores simultaneously to stop watchdog petting across the system.
For example,
```text theme={null}
wdg disable
```
The following sample logs show the watchdog disabled for all cores:
```text theme={null}
c0[ 7.388680s]use help or exit command….
c0[ 7.388752s]sail_proc@home$
c0[ 10.105693s] [ WDT ] WDT disabled for core 0
c0[ 10.105734s][WDT] : Core_0 wdt disable performed
c1[ 10.105998s] [ WDT ] WDT disabled for core 1
c1[ 10.106022s][WDT] : Core_1 wdt disable performed
c2[ 10.106185s] [ WDT ] WDT disabled for core 2
c2[ 10.106209s][WDT] : Core_2 wdt disable performed
c3[ 10.106273s] [ WDT ] WDT disabled for core 3
c3[ 10.106297s][WDT] : Core_3 wdt disable performed
c0[ 10.106569s][WDT test] disable command send
c0[ 10.106603s]use help or exit command….
c0[ 10.106639s]sail_proc@home$
```
Note
* If all active cores (Core 0, Core 1, Core 2, and Core 3) remain idle for more than 30 seconds, they enter the Sleep state. In the Sleep state, the `wdg disable` command can’t disable the watchdog on Core 1, Core 2, and Core 3. Additionally, commands executed while the cores are in the Sleep state don’t take effect on Core 1, Core 2, and Core 3.
c0\[ 197.375209s] come for WDG disable core \[0]
**High-level IQ-9075 client/server connection**
**TCP test**
To perform a TCP test, start the server by running the following command:
```text theme={null}
nw server start [port]
```
Example:
```text theme={null}
nw server start 7777
```
Run the following command to do the TCP test:
```text theme={null}
nw tcp connect
```
```text theme={null}
nw tcp send
```
```text theme={null}
nw tcp close
```
Parameters:
* ``: IP address of the remote TCP server.
* ``: Port number on the remote TCP server.
* ``: Data payload to send over the active TCP connection.
Example:
```text theme={null}
nw tcp connect 192.168.200.10 7777
```
```text theme={null}
nw tcp send hello
```
```text theme={null}
nw tcp close
```
**UDP test**
Run the following command to do the UDP test:
```text theme={null}
nw udp send [size]
```
Parameters:
* ``: IPv4 address of the remote host.
* ``: Port number on the remote host.
* `[size]`: packet payload size, in bytes.
Example:
```text theme={null}
sail_proc@home$ nw udp send 192.168.200.10 9999 32
```
## **Watchdog test commands**
By default, Watchdog is enabled after device bootup. Watchdog enable and disable commands provide feasibility for debugging the software faults. To run the RTSS watchdog commands, do the [Prerequisites](https://dragonwingdocs.qualcomm.com/System/FreeRTOS/RTSS-test-commands#prerequisites-2).
### **Disable all watchdogs**
The `wdg disable` command disables all four cores simultaneously to stop watchdog petting across the system.
For example,
```text theme={null}
wdg disable
```
The following sample logs show the watchdog disabled for all cores:
```text theme={null}
c0[ 7.388680s]use help or exit command….
c0[ 7.388752s]sail_proc@home$
c0[ 10.105693s] [ WDT ] WDT disabled for core 0
c0[ 10.105734s][WDT] : Core_0 wdt disable performed
c1[ 10.105998s] [ WDT ] WDT disabled for core 1
c1[ 10.106022s][WDT] : Core_1 wdt disable performed
c2[ 10.106185s] [ WDT ] WDT disabled for core 2
c2[ 10.106209s][WDT] : Core_2 wdt disable performed
c3[ 10.106273s] [ WDT ] WDT disabled for core 3
c3[ 10.106297s][WDT] : Core_3 wdt disable performed
c0[ 10.106569s][WDT test] disable command send
c0[ 10.106603s]use help or exit command….
c0[ 10.106639s]sail_proc@home$
```
Note
* If all active cores (Core 0, Core 1, Core 2, and Core 3) remain idle for more than 30 seconds, they enter the Sleep state. In the Sleep state, the `wdg disable` command can’t disable the watchdog on Core 1, Core 2, and Core 3. Additionally, commands executed while the cores are in the Sleep state don’t take effect on Core 1, Core 2, and Core 3.
c0\[ 197.375209s] come for WDG disable core \[0]
c0\[ 197.375253s] \[ WDT ] WDT disabled for core 0
c0\[ 197.375291s]\[WDT] : Core\_0 wdt disable performed
c0\[ 197.375765s]\[WDT test] disable command send
* When user selects Enter on RTSS console, then core 0 will exit the Sleep state and watchdog is enabled as UART interrupts are registered on core 0. External interrupts are required for cores 1, core2, core3 to exit Sleep mode.
c0\[ 260.591159s]sail\_proc\@home\$
c0\[ 266.639045s]\[WDT] Watchdog enabled on core 0 cluster-: 0
c0\[ 266.639184s] \[ WDT ] Petting started for core 0
c0\[ 266.639592s]\[WDT] Petting Queuesend success with time-: 55000 core-:0
c0\[ 266.639641s]\[WDT] : Core\_0 wdt enable performed
### **Enable watchdog**
The `wdg core enable` command enables the watchdog for the specified core. The watchdog starts counting and expects periodic petting.
```text theme={null}
wdg core enable
```
Parameter: `N` is core number.
**Note**
For a split-split cluster configuration, the number of cores is 4. For a split-lock configuration, the number of cores is 3.
For example,
```text theme={null}
wdg core0 enable
```
The following sample logs show the watchdog enabled for core0:
```text theme={null}
c0[ 199.846578s]use help or exit command….
c0[ 199.846879s]sail_proc@home$
c0[ 203.893654s]enable : Wdg test
c0[ 203.893976s]Wdg Core0 enable : Passed
c0[ 203.894369s]use help or exit command…
```
### **Disable watchdog**
The `wdg core disable` commands disables the watchdog for the specified core. The counter stops and no reset will be triggered.
```text theme={null}
wdg core disable
```
Parameter: `N` is core number.
For example,
```text theme={null}
wdg core0 disable
```
The following sample logs show the watchdog disabled for core0:
```text theme={null}
c0[ 199.846578s]use help or exit command….
c0[ 199.846879s]sail_proc@home$
c0[ 203.893654s]enable : Wdg test
c0[ 203.893976s]Wdg Core0 disable : Passed
c0[ 203.894369s]use help or exit command…
```
### **Trigger watchdog bite**
The `wdg core triggerbite ` command forces an immediate watchdog bite on the specified core after the given timeout in milliseconds. This is used to test the bite-triggered reset and recovery sequences.
```text theme={null}
wdg core triggerbite
```
Parameters:
* `N`: Core number
* `time_ms`: Timeout value in milliseconds
For example,
```text theme={null}
wdg core0 triggerbite 50
```
The following sample logs show the watchdog trigger bite for core 0:
c0\[ 1930.862604s] Wdg Core0 triggerbite : Passed
c0\[ 1930.863200s] BITE trigger recived on core 0
Note
After exection of this command, the device enters the Crash state.
### **Verify window maximum violation**
The `wdg core winmax` command tests the window maximum violation behavior, such as the watchdog is deliberately not petted until after WIN\_MAX, verifying that a bark interrupt is correctly generated.
```text theme={null}
wdg core winmax
```
Parameter: [\`\`](https://docs.qualcomm.com/doc/80-70033-42/topic/test-commands.html#id8)N\`\`is core number.
### **Verify window minimum violation**
The `wdg core winmin` command tests the window minimum violation behavior, such as the watchdog is petted before WIN\_MIN, verifying that a window error interrupt is correctly generated.
```text theme={null}
wdg core winmin
```